LIBRARY
Field Modeling for Plate-Core Inductor With Significant Fringing Using Equal-Flux Contours

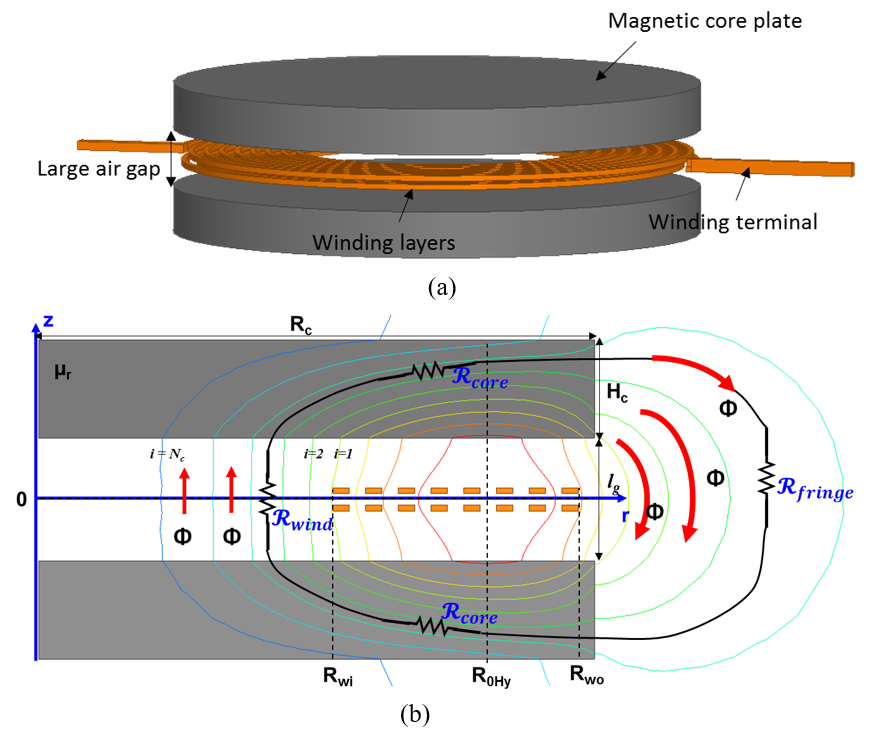
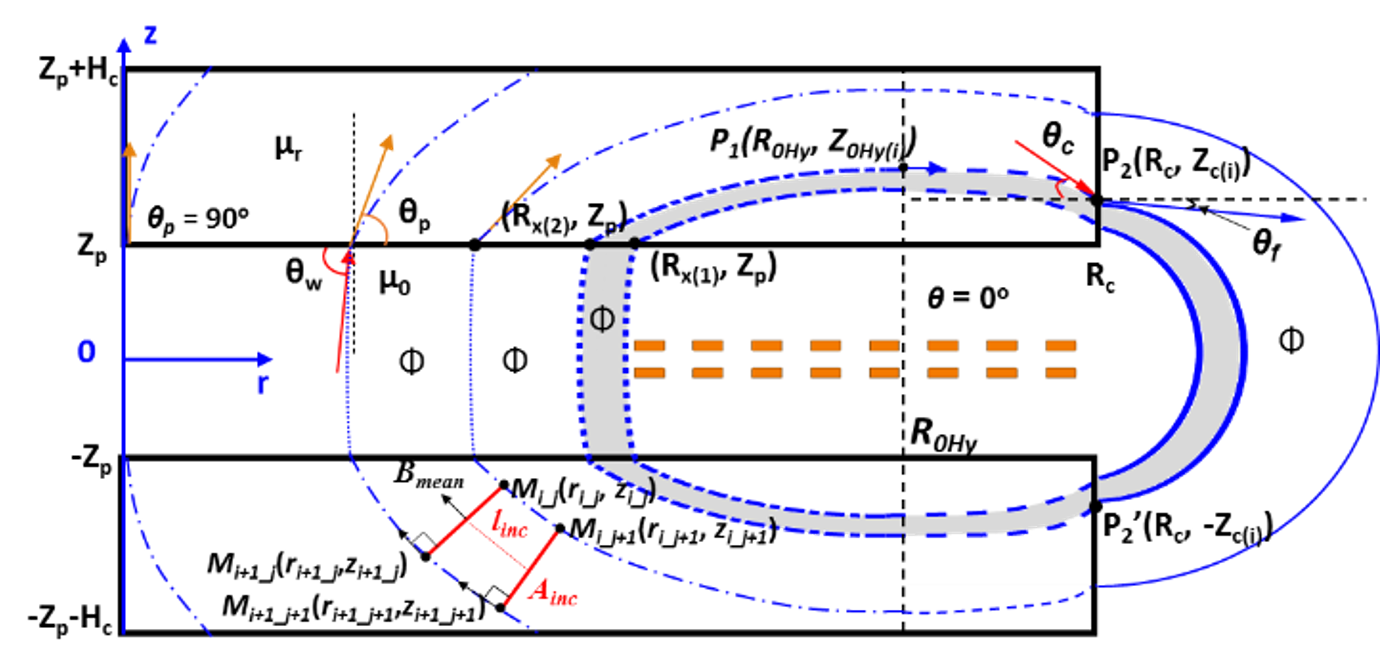
The proportional reluctance, equal-flux (PREF) model is introduced to model the magnetic field distribution for the plate-core inductors with finite core dimension (Rwo ≈ Rc). The PREF model is motivated by generating equal-flux lines by making the reluctance of each path proportional to the Ampere turns. Two elliptical functions, a hyperbolic tangent function and Schwartz-Christoffel transformations, are used to model the shape of the flux lines guided by finite-element simulation (FES). The procedure to construct all the flux lines is demonstrated with an example. The number of total flux lines is governed by the selection of the initial path. The magnetic field at an arbitrary position is found from these equal-flux paths. The inductance (energy) based on the field modeled is verified by both FES and experimental results. Compared to existing modeling methods, the error for field calculation is reduced to less than 10 percent by considering the fringing behavior with a finite core dimension. The application of this method to coupled inductors, as well as ac losses calculation based on the field, will be covered in future publications.


