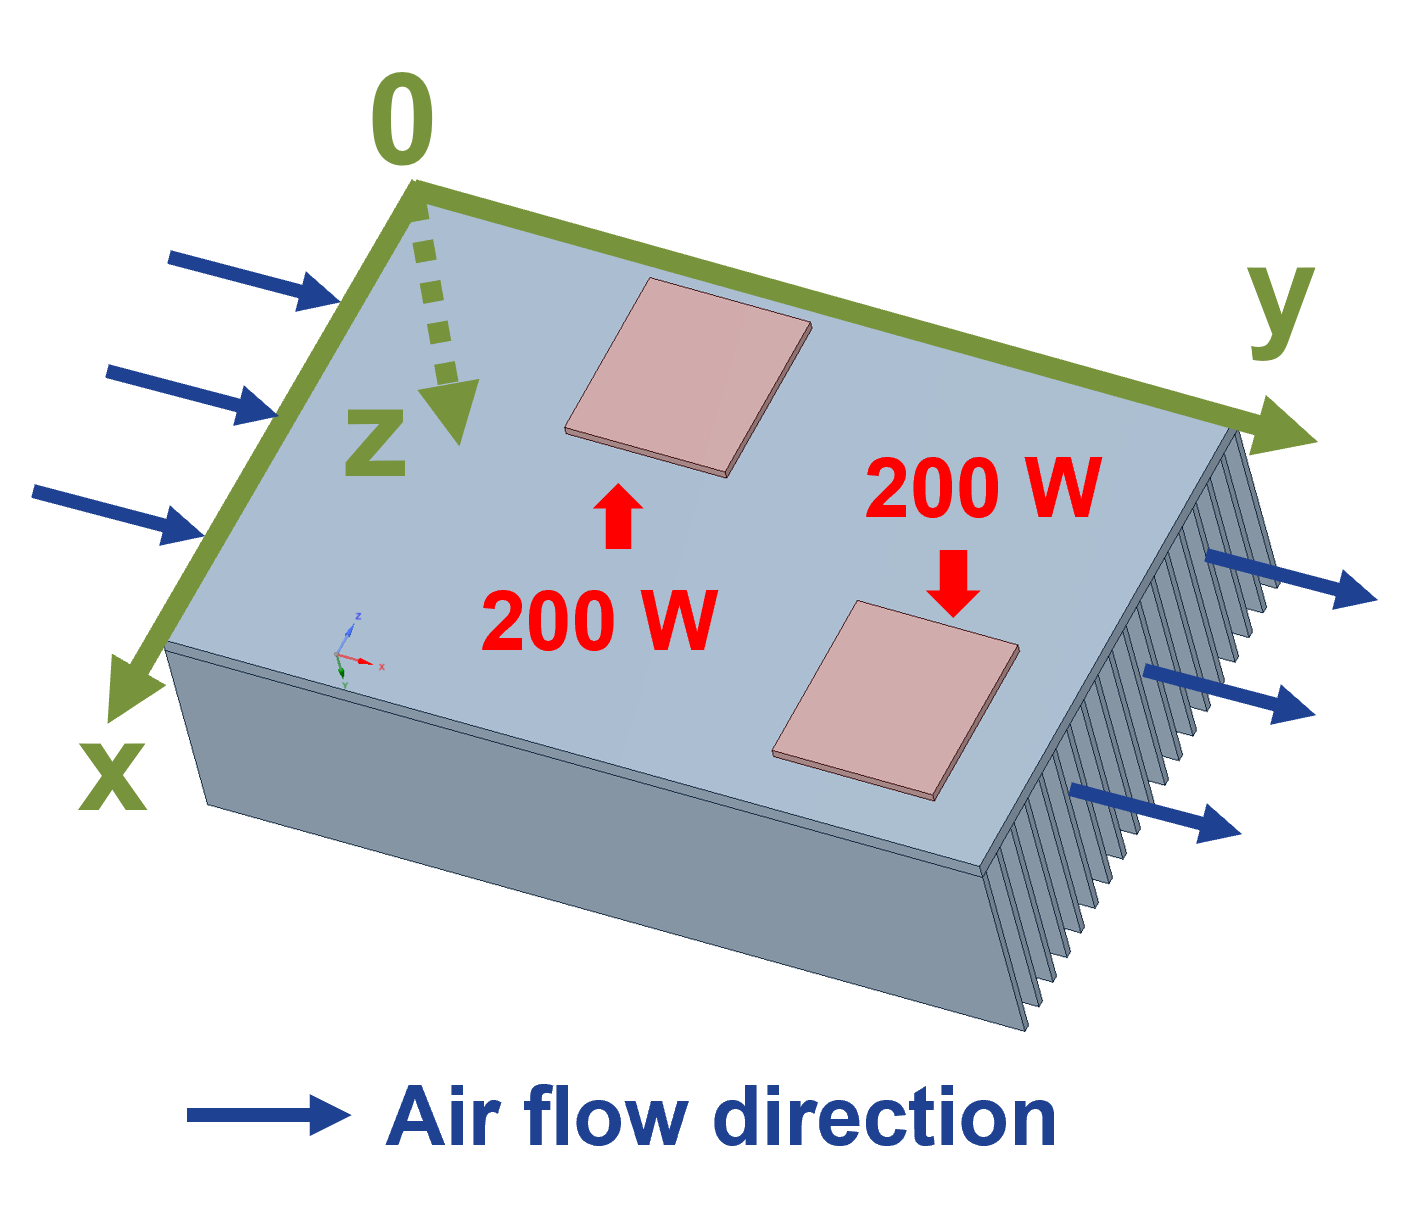
Fig. 1(a). Temperature distribution across heatsink top surface with two heat sources. Heatsink model.
In this work, a weight-optimized thermal management system for the switching module is designed, considering all operating functions of a medium-voltage modular converter in a ship power conditioning system application. In the first step, a worst-case loss analysis is conducted for the switching device, covering all operating conditions of the medium-voltage modular converter. A thermal management system is then designed to dissipate the maximum loss. To embed the thermal management system design into the hierarchical power system optimization process, an analytical model is constructed for the cooling system with improved design efficiency and accuracy. In this analytical model, a heat transfer coefficient h is first calculated, considering the fan selection and the dimensions of the heatsink. Then, by assuming the Neumann boundary condition, a heat-spreading model is constructed for the heatsink base plate. From this model, the temperature distribution across the heatsink top surface is obtained, and the hot spot temperature under the heat source is calculated, which can be used to estimate the junction temperature of the switching device. Other applications of this analytical thermal model involve the optimum placement study of a power module and the thermal coupling study of multiple heat sources on a single cooling plate. The accuracy of this analytical thermal model has been verified by both simulations and experiments. Fig. 1 shows one of the application examples with this analytical thermal model. In this design example, as depicted in Fig. 1(a), two heat sources, which each dissipates a 200 W of loss, are placed on the top surface of the heatsink of known dimensions. Applying the analytical model, the temperature distribution across the top heatsink surface is calculated. The result is plotted and then compared with the FEA simulation, as shown in Fig. 1(b).
From the comparison, it is observed that the thermal distribution under the heat sources is accurately predicted by the analytical model with a maximum error of 6°C. The experiment validation process is also implemented and will be illustrated in the final paper. In summary, a maximum error of 15 % is achieved for all test points.
This work was supported by the Office of Naval Research (ONR),with grant number N00014-16-1-2956. DCN: 43-9044-22.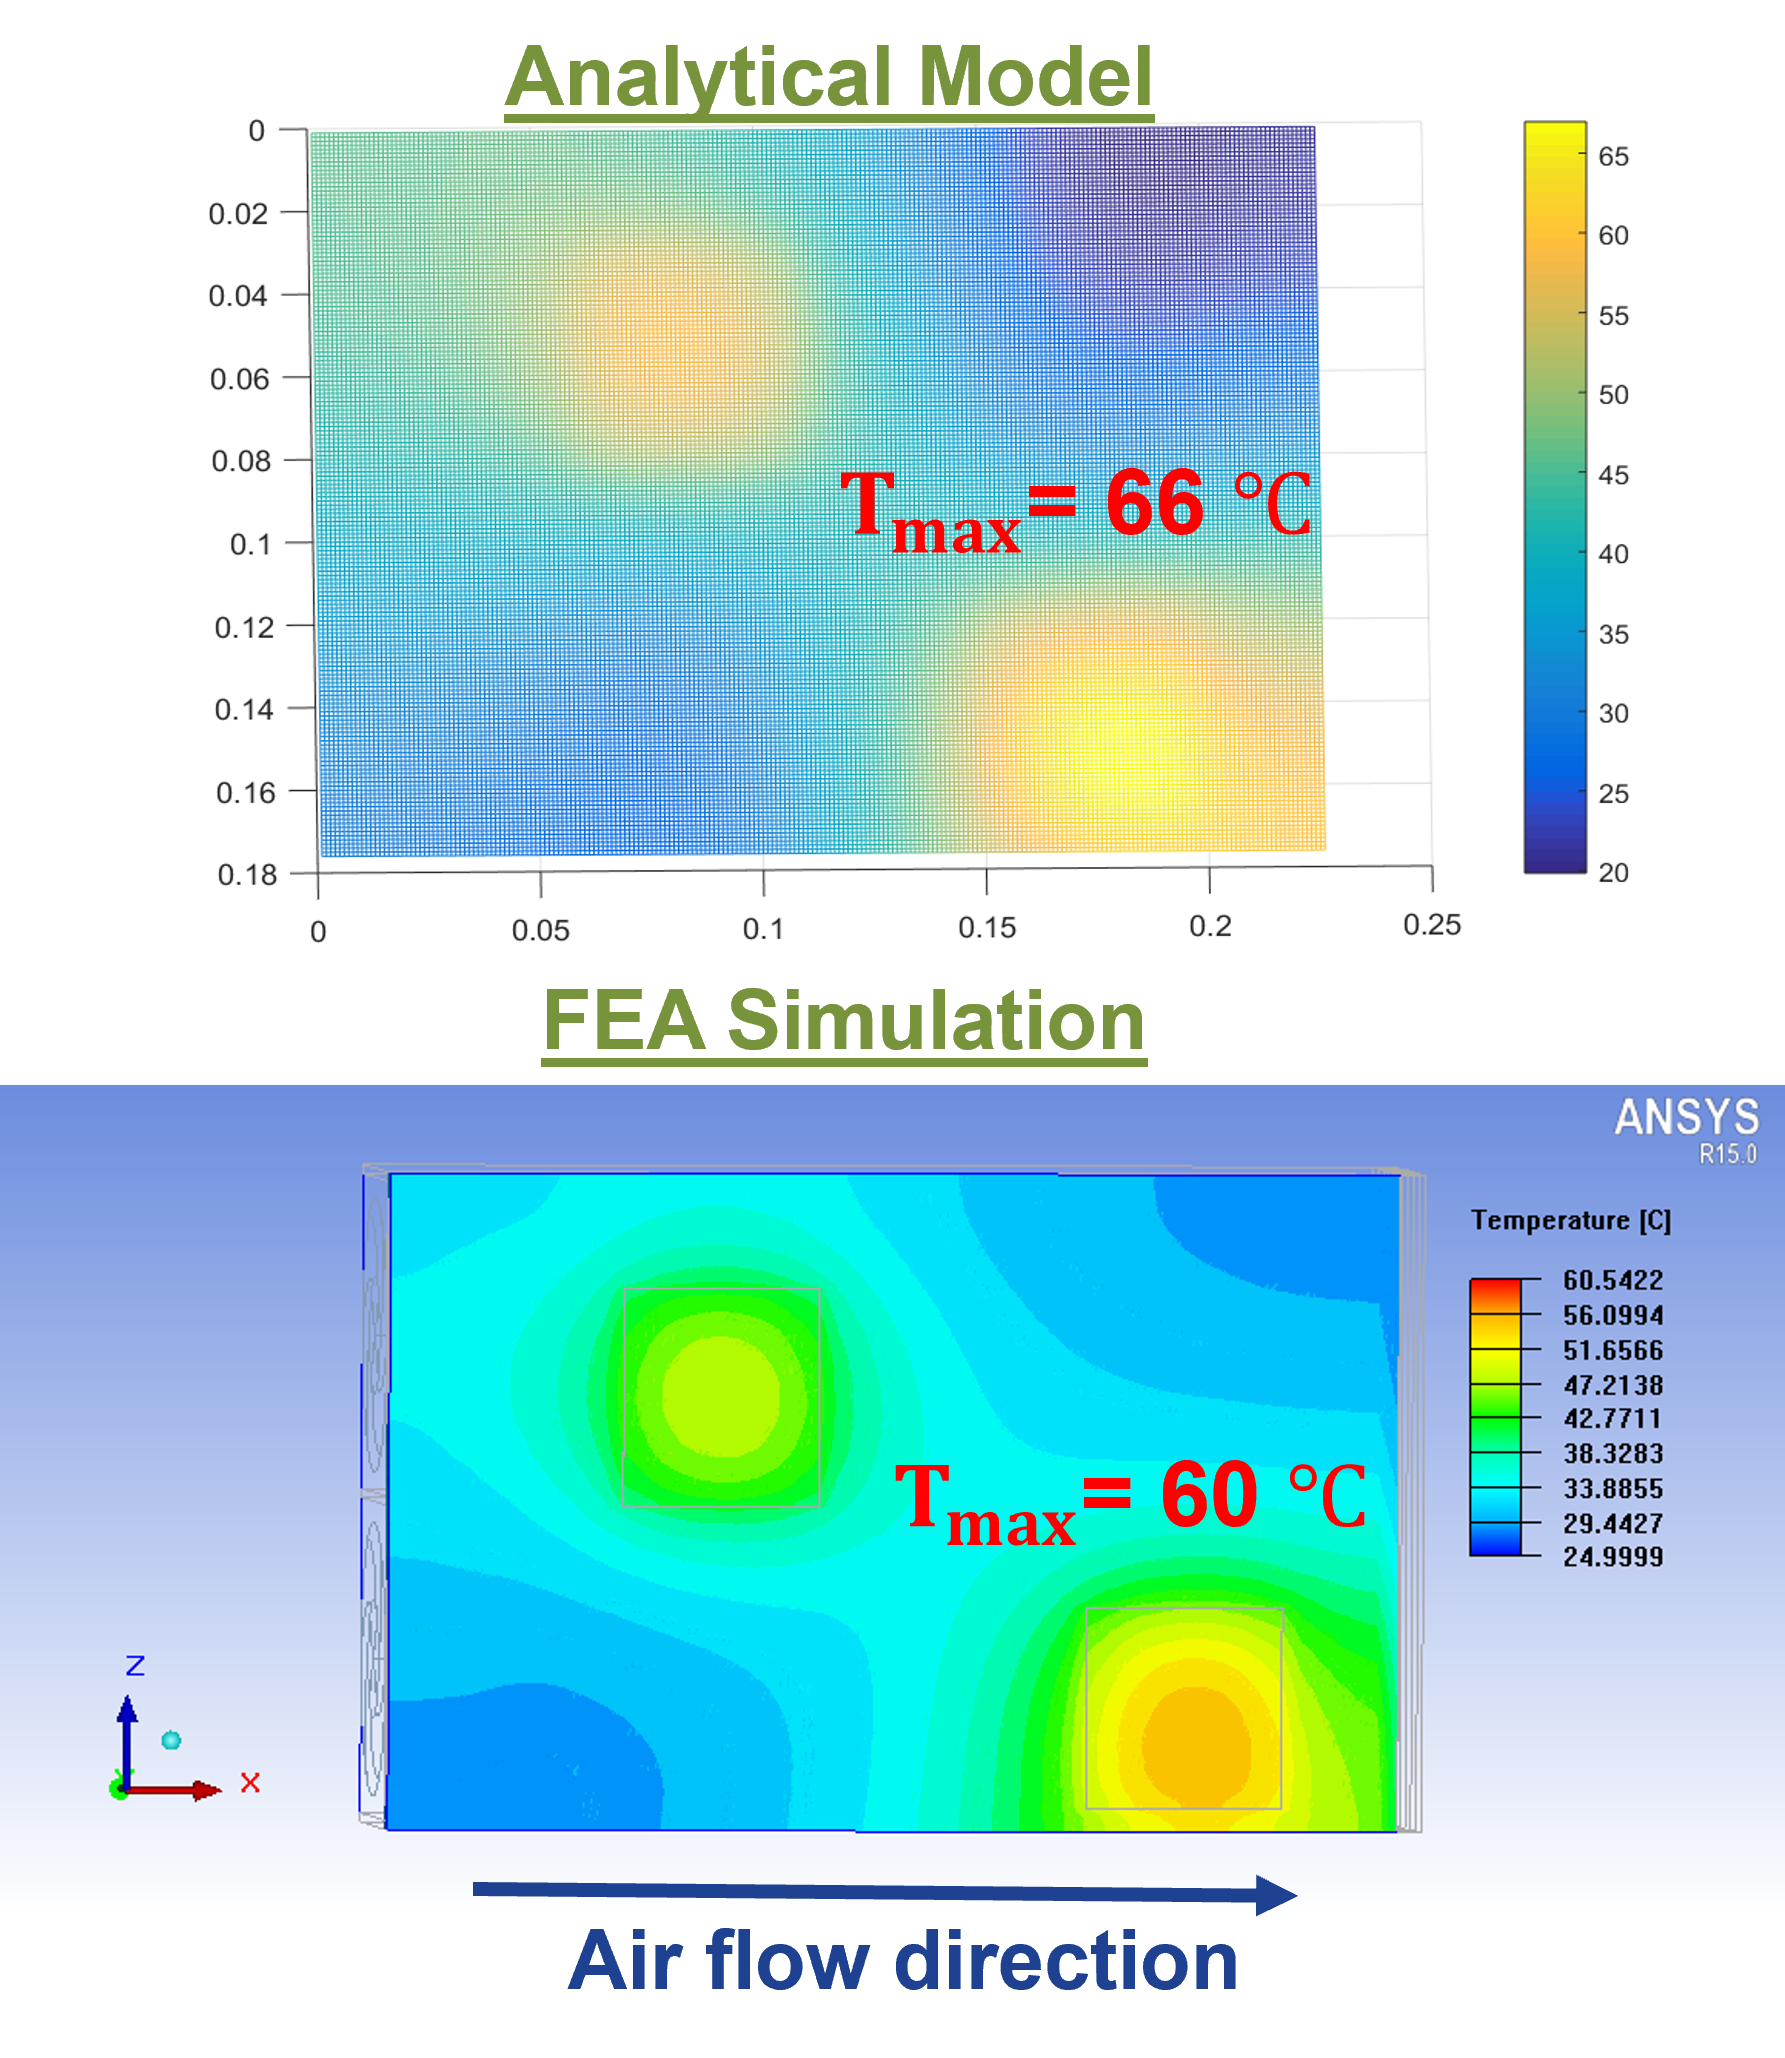
Fig. 1(b). Compare temperature distribution prediction across heatsink top surface between analytical thermal model and FEA simulation.