


LIBRARY
Characterization and comparison of seven different 1.2 kV SiC power semiconduc-tor devices at high temperature
Year: 2013
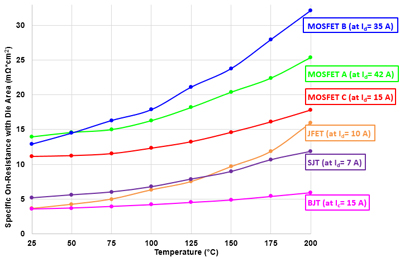
Fig. 1. Specific on-resistance vs. temperature.
With the emergence of these new SiC devices, the question of how the performances of each compare to one another arises. Consequently, the focus of this research is to characterize and compare SiC power semiconductors. The static and dynamic characteristics of seven 1.2 kV SiC power semiconductor devices will be analyzed at temperatures from 25°C to 200°C. The studied devices are: three 1.2 kV SiC MOSFETs, two 1.2 kV SiC BJTs, a 1.2 kV normally-off SiC JFET, and a 1.2 kV SiC SJT.
For the static performance comparison, the specific on-resistance of each device will be analyzed. The on-resistance of each semiconductor will be measured up to 200°C, and then specific on-resistance will be calculated using die area (Fig. 1). This is done to allow for valuable comparison among the various devices since resistance and size are indirectly related. The means of comparison for the dynamic performance of each device is switching energy loss density. A double-pulse test (DPT) will be performed on each device up to 200°C, from which the switching loss will be computed. Dividing this computed loss by the die area yields the switching energy loss density. Fig. 2 shows the high-temperature DPT setup used for measuring switching loss.
A full comparison among all of the devices will then be obtained by using the on-resistance to compute the conduction power loss density and the switching energy loss density to calculate the switching power loss density. It is expected that there will be a tradeoff between the static and dynamic performances, thus it is important to take both into account when comparing all of the devices by summing the conduction and switching power loss densities to find the total power loss density.
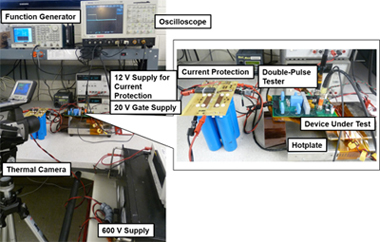
Fig. 2. High temperature DPT setup.