

LIBRARY
Improved Unterminated Behavioral Model for Common-Mode EMI Emission of SiC Power Converters with Different Switching Frequencies
Year: 2015
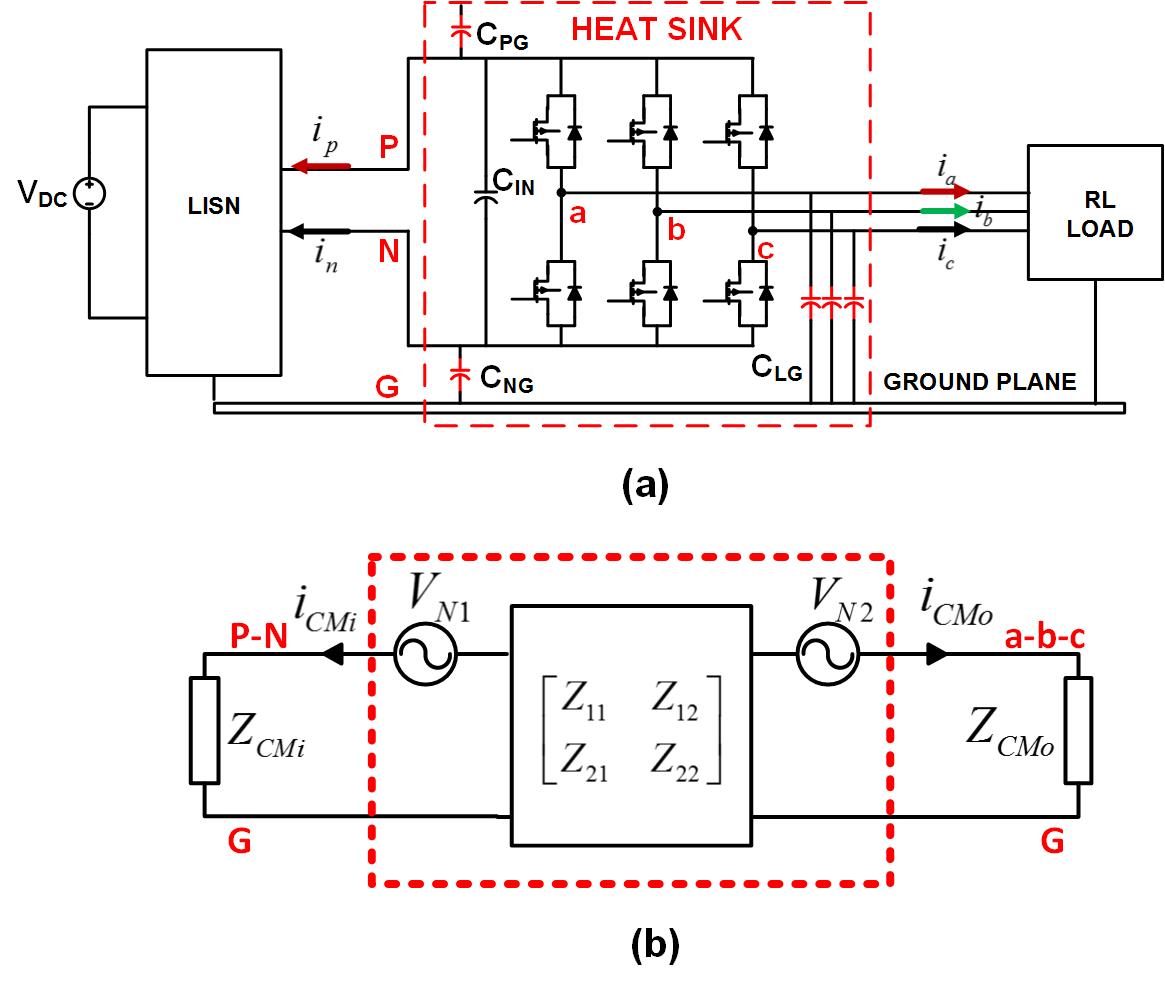
Fig. 1: (a) Three-phase SiC MOSFET inverter setup schematic diagram (b) Unterminated behavioral model to be extracted
In this paper, the noise floor, which is the main factor limiting UBM prediction above 10 MHz, is found to occur from 6 MHz in the experiments. This is caused by the limited vertical resolution of the oscilloscope. The development of a segmented-frequency measurement with high-pass filters is proposed to acquire the CM spectrum above 6 MHz, by ranges of 6 MHz to 15 MHz, and 15 MHz to 30 MHz, which covers the whole EMI range. With this proposed method, there is no noise floor in the noise spectrums, and the UBM prediction capacity is extended to 30 MHz in the experiment. In Fig. 2, the prediction of input and output CM spectrums by the UBM matches the measurement of the 3 kW, 300 V DC, SiC three-phase inverter, switching at 20 kHz. Additionally, when the inverter is working with a switching frequency as high as 70 kHz, the UBM can provide good prediction of CM input and output noise, matching measurements in the entire EMI range.
Furthermore, this paper improves the extraction fixture by reducing the equivalent series inductance and acquiring high-accuracy impedance measurements. With the redesigned fixture, the error between the prediction from the UBM and the actual measurement is even smaller, showing a perfect match.
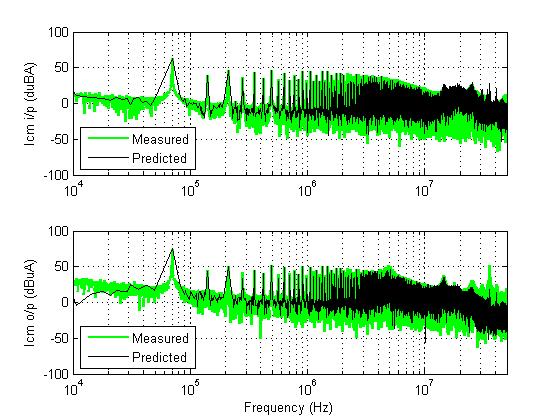
Fig. 2 Comparisons between the measurements (light) and the predictions (dark) for the 20 kHz validation case with some chokes