


LIBRARY
Differential-mode EMI emission prediction of SiC-based power converters using a mixed-mode unterminated behavioral model
Year: 2016
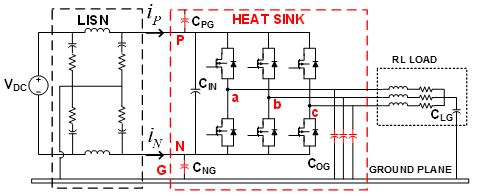
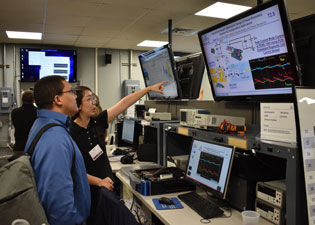
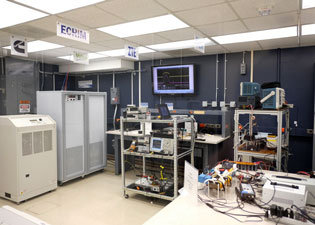
Fig. 1. Three-phase power inverter diagram and the experi-mental setup.
The experimental measurements with different CM and DM chokes show that on the input side of this setup the DM input noise is coupled with CM noise, and is dependent on the CM noise propagation path in the system. The DM input model should consider the CM components: the CM noise propagation path and CM noise sources. Then the mixed-mode unterminated behavioral model (MUBM) is proposed, shown by the dashed line in Fig. 2, which contains the entire propagation path at the input, including the parasitics like CPG and CNG, that are illustrated in Fig. 1. From the model, it can be derived that the DM noise is independent of ISCM and ZL if and only if ZPG and ZNG are equal. If ZPG and ZNG are equal, or CPG and CNG are symmetric, the DM noise is generated only by and propagates within the DM loop. Otherwise, ZL and ISCM have an effect on the DM noise.
In order to extract the five model parameters, there are two experiments performed: one to determine the noise sources, the other to determine ZPG and ZNG. ZL can be measured with the impedance analyzer. With the model, the DM noise can be calculated or predicted. Fig. 3 provides a comparison between the model predictions and the experimental measurements of the DM noise, where there is a good match between the prediction and the measurements above 30 MHz. Furthermore, Fig. 3 also shows that with a different EMI filter, or with a different CM or DM propagation impedance, the model can capture the change and predict the DM noise accurately.
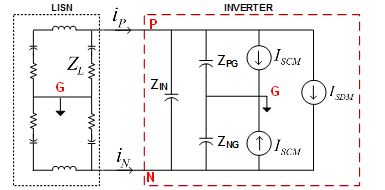
Fig. 2. Proposed mixed-mode terminated behavioral model.
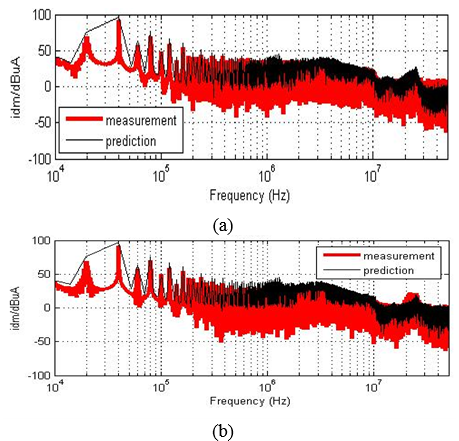
Fig. 3. The comparison of the measured (light) and predicted (black) DM spectrum (a): Without CM or DM choke; (b): With CM choke.