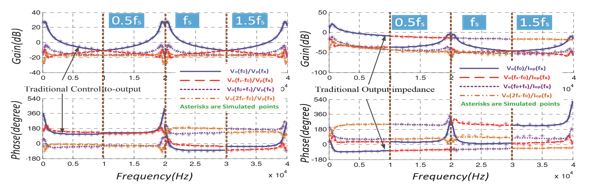
Fig. 1. Output to control characteristics
Power electronic converters are typical nonlinear systems in frequency domain. With a perturbation frequency excitation, the current and voltage of power converters in steady state contain not only perturbation but also many sidebands. In a microgrid containing a large amount of power converters, one converter's switching frequency ripples are the other converters' perturbations and beat frequency components will be generated if the switching frequencies of those power converters are different. Since the control loops always take high gains in low frequency regions and the low pass filters almost have no effect on low-frequency disturbances, the beat frequency component has certain values that may be magnified and presented as oscillations. This paper develops a frequency domain model to describe the characteristics of the power converter around a switching frequency range and to analyze the high frequency interactions of power converters in micorgrid. The voltage mode controlled boost converters are illustrated as a demonstration. The proposed model indicates that the switching frequency affects the output characteristics of power converters significantly. In a system consisting of two boost converters in parallel, the beat frequency oscillation that traditional output impedance models fail to explain could be accurately predicted by the proposed model. In addition, based on this model, a design guideline is proposed to avoid the potential beat frequency oscillation in parallel system. Simulation results validate the accuracy and effectiveness of the proposed method.
In Fig.1, the control to output characteristics have periodicity and symmetry; in addition, the component below half switching frequency (represented by f
0) always takes the largest agnitude. It can be seen from Fig. 2 that when perturbation frequency is switching frequency, output voltage only contains dc and switching frequency harmonics. When perturbation frequency is far away from switching frequency, such as 18 kHz and 22 kHz, although there are 2 kHz low frequency component in output voltage waveforms, their magnitude is very small compared with switching frequency ripple.
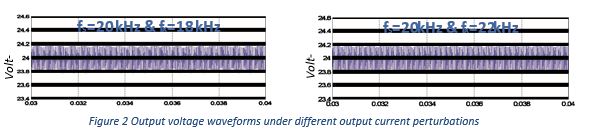
Output voltage waveforms under different output current perturbations