


LIBRARY
Modeling of a 600 V 2 A Vertical GaN Transistor
Year: 2018 | Author: Grace Watt | Paper: D1.1
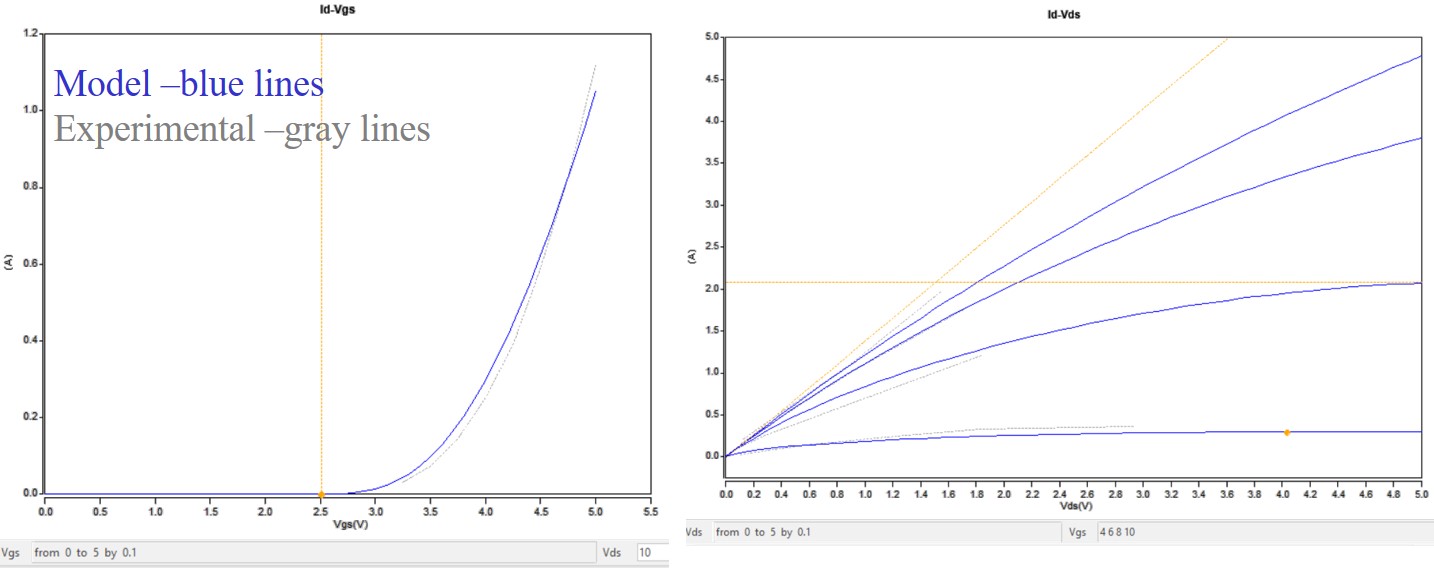
Fig. 1. Output and transfer curves for GaN vertical transistor: model (blue) and experimental (gray).
The GaN vertical model static behavior aligns with that of the experimental characterization process, with a characteristic curve error ranging between 6.02 and 8.42 percent. An initial test produced a transfer curve with 5.98 percent error and output curves with 9.34 percent error. The suggested adjustment by the Saber® developer to remove data points at or below the threshold voltage for the transfer curve, and points or curves near zero, reduces the time for optimization and the error to 6.13 and 5.41 percent, respectively. Unfortunately, with the addition of the experimental Rds curve, the error jumps to 8.17 and 8.42 percent, respectively (Fig. 1). Furthermore, the Rds curve has a 6.02 percent error that equates to a value about 10 mΩ less than desired.
Due to the inaccuracies and limitations in the static data, the model turns on in 30 ns rather than an experimentally demonstrated 8.48 ns and turns off in 140 ns rather than 30.2 ns. With the addition of planned experimental capacitance measurements, the switching speeds should increase as desired.
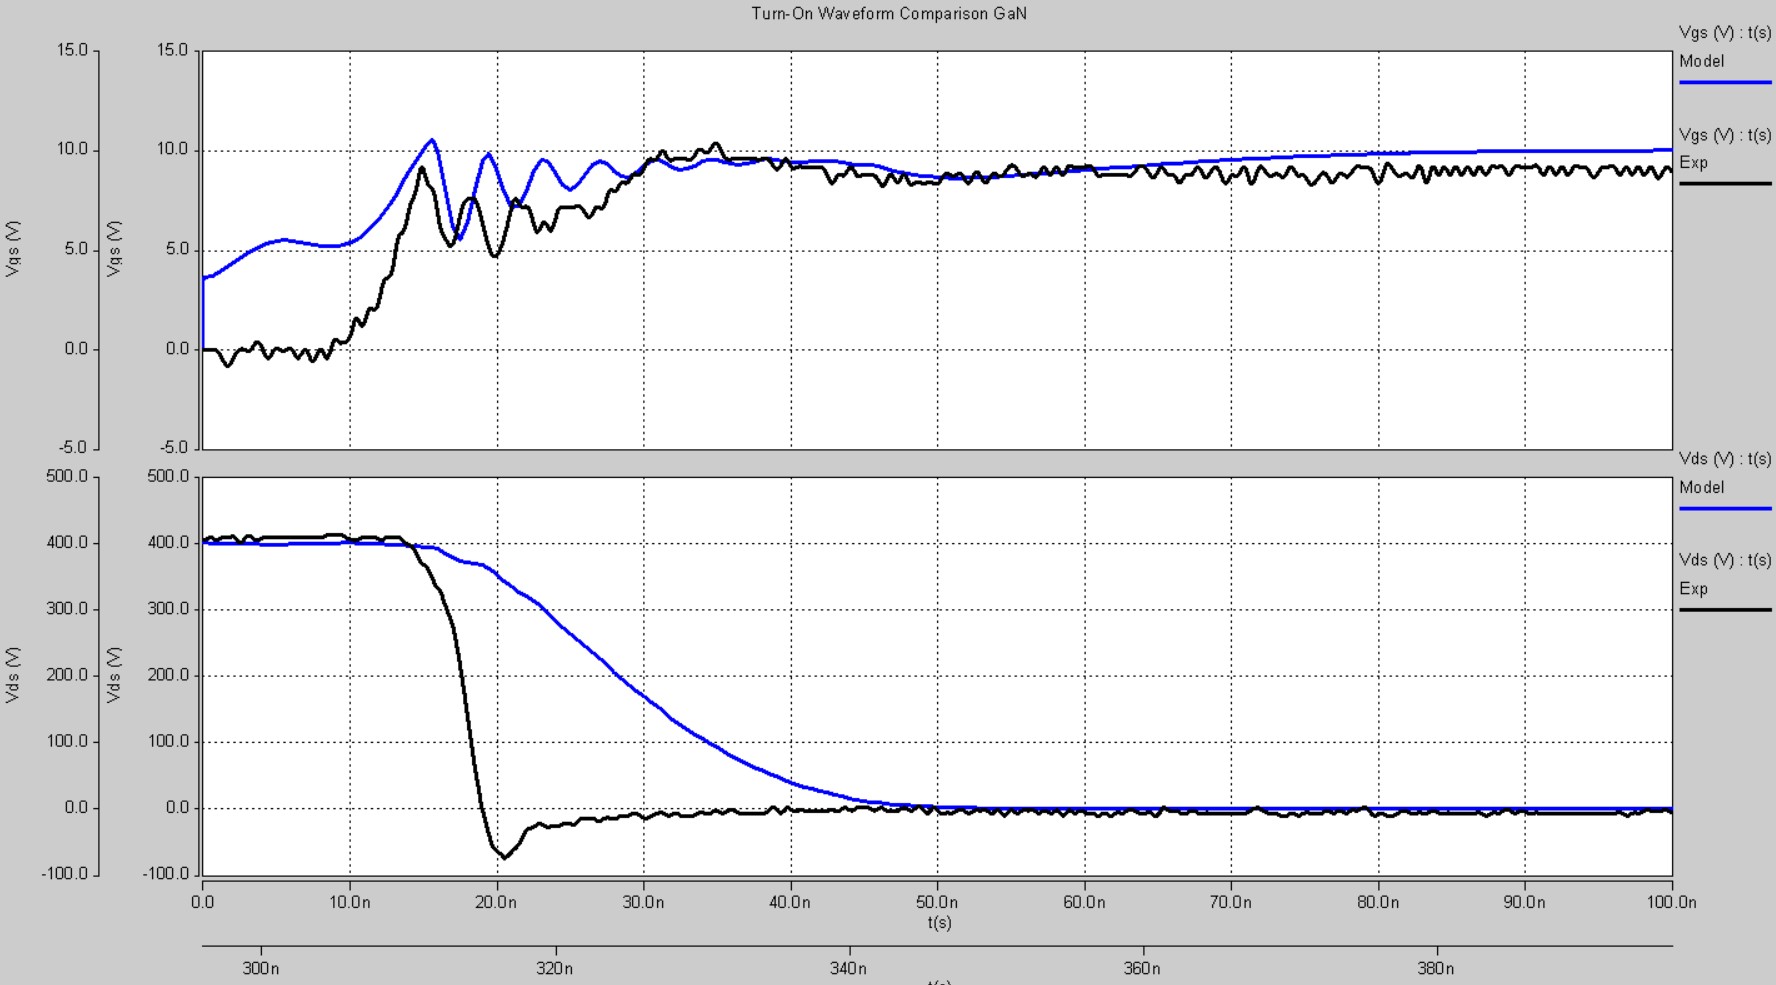
Fig. 2. Turn-on waveforms for GaN vertical transistor: model (blue) and experimental (gray).