LIBRARY
Control of the Modular Multilevel Converter (MMC) Based on the State Plane Analysis and ΣΔ Coordinate Transformation

C. Li proposed a state plane analysis to visually illustrate energy storage and power flows. In this analysis, the circulating energy related to source and load, in addition to the circulating energy swapping between capacitors, was explained for the first time. He also demonstrated that the two different kinds of circulating energy can be decoupled into two orthogonal axes vΣ and vΔ.
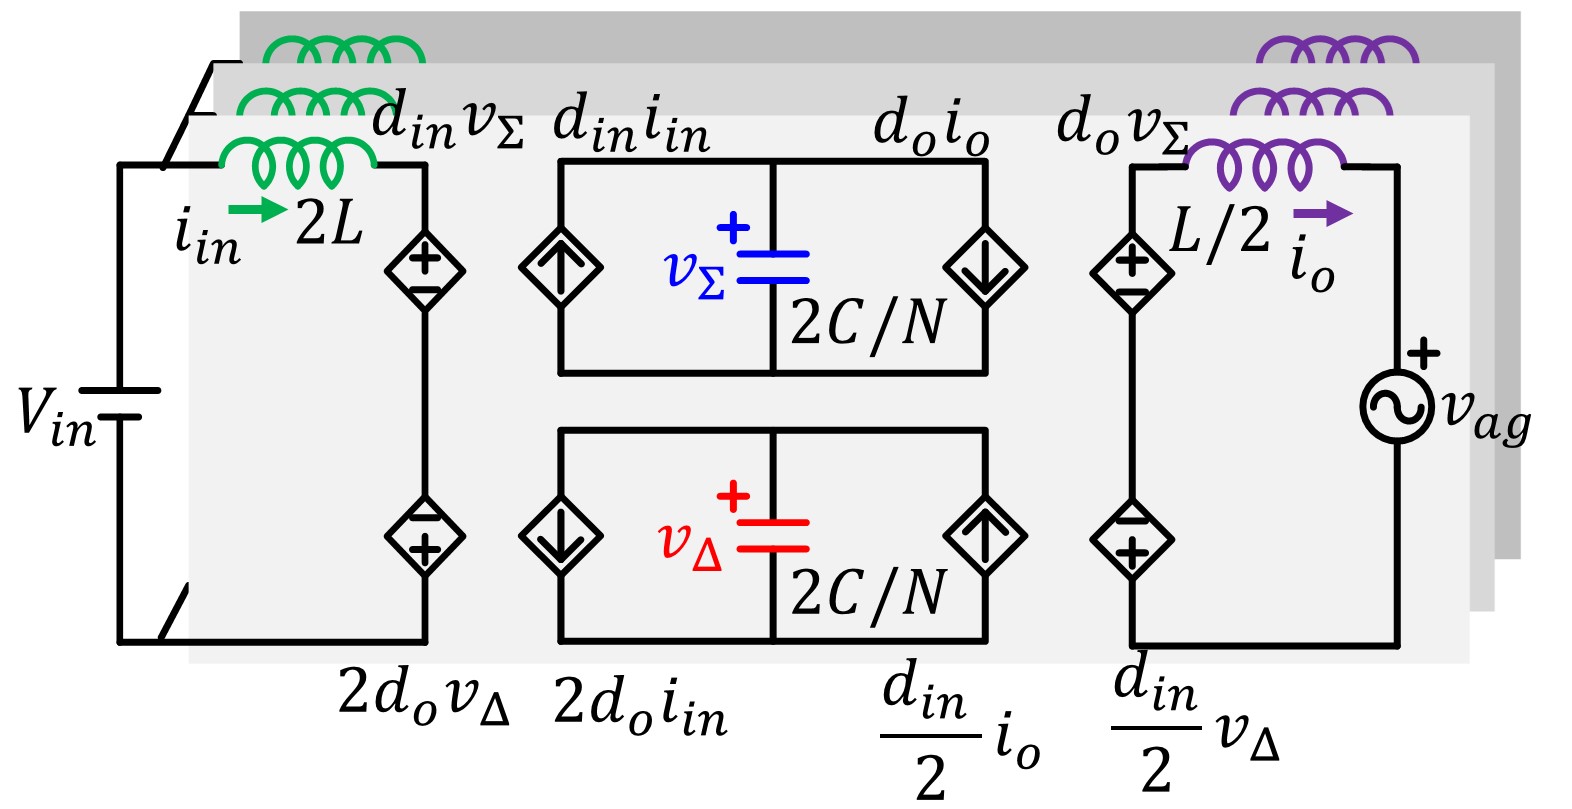
Based on C. Li's state plane analysis, Y. Hsieh proposed a decoupled ΣΔ model of MMC as shown in Fig. 1. Assuming a strong dc bias voltage on the capacitors, the upper controlled voltage sources, dinvΣ and dovΣ, have much stronger influences than the lower controlled voltage sources, 2dovΔ and dinvΔ/2. Therefore, in the qualitative sense, one can state that the upper portion of the equivalent circuit is mainly responsible for the power throughput, while the lower portion of the circuit mainly represents the circulating energy swapping between the upper-arm module and lower-arm module.
Based on the proposed equivalent circuit model, two control laws can be readily defined:
Eq. 1.
diniin = doio
Eq. 2.
2doiin = dinio/2
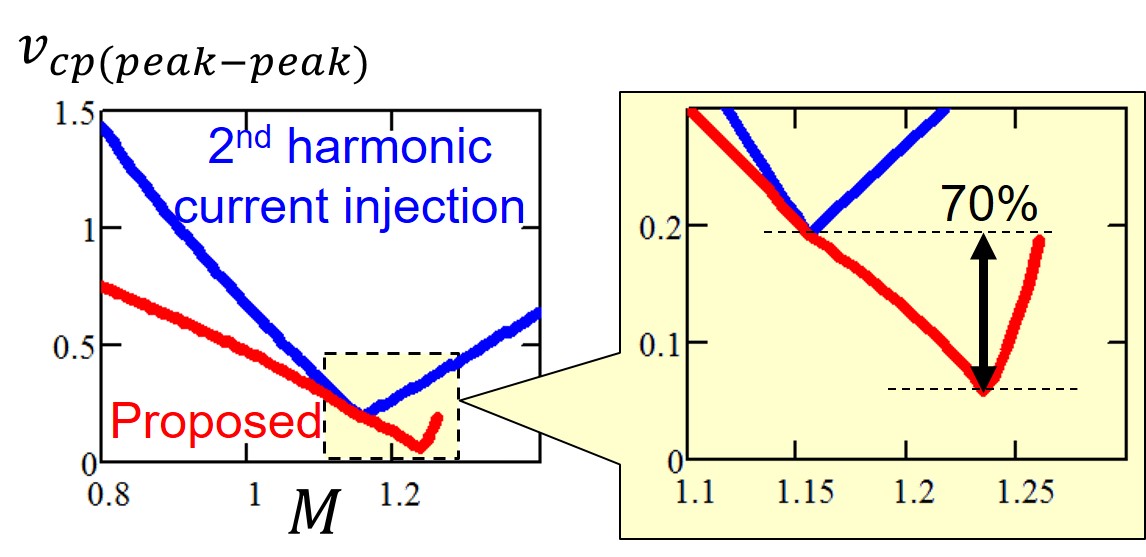
To implement Eq. 1 and Eq. 2, a current injection and a third order harmonic common-mode voltage injection are proposed. The voltage ripple is proportional to the energy stored in the capacitor. As a result, the comparison made in Fig. 2 shows that the proposed method achieves significant reduction over the entire operating range of voltage gain.


