LIBRARY
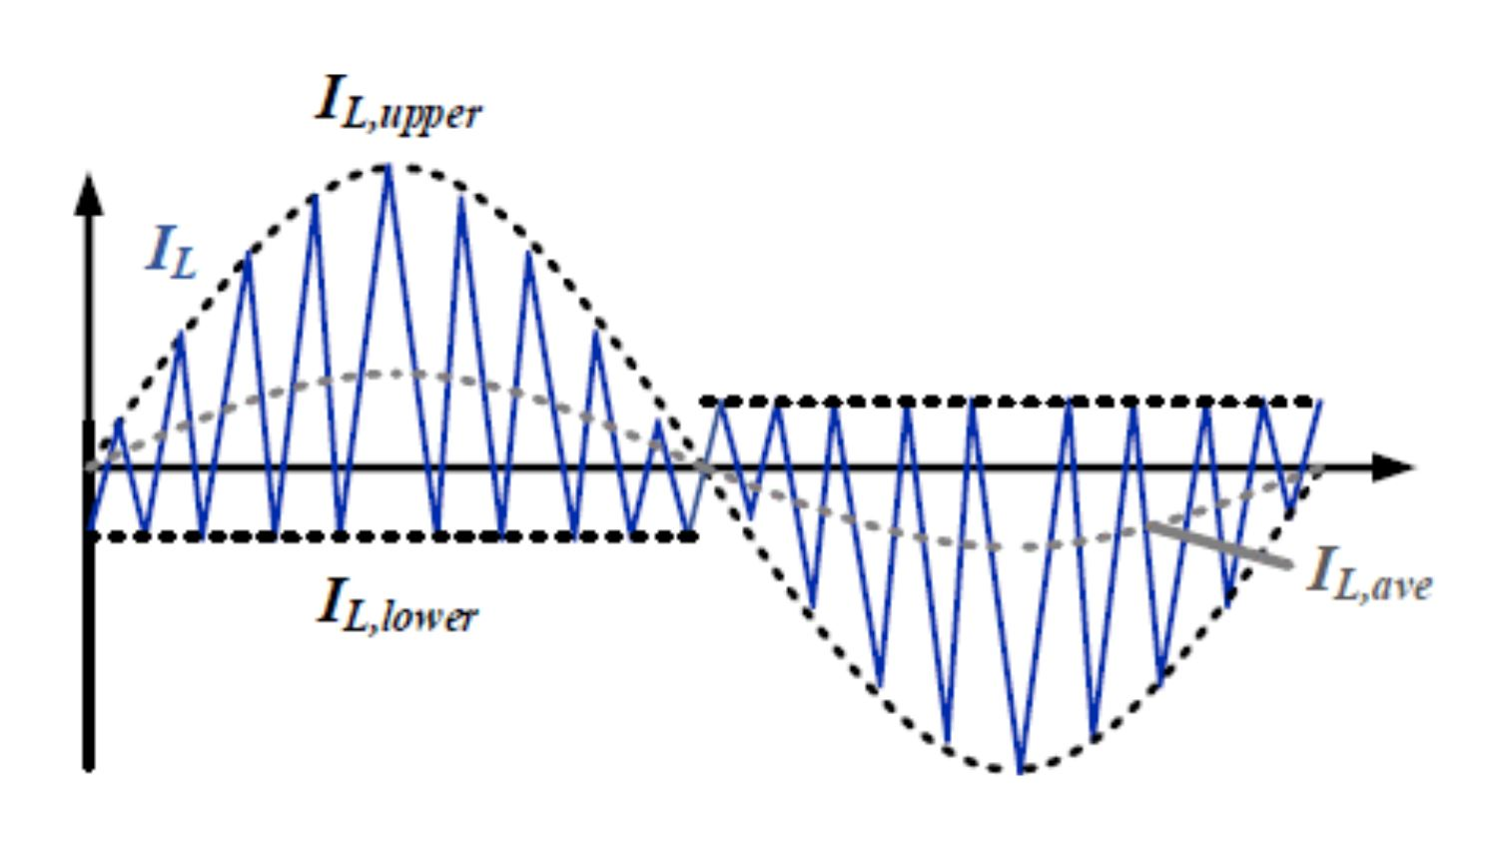
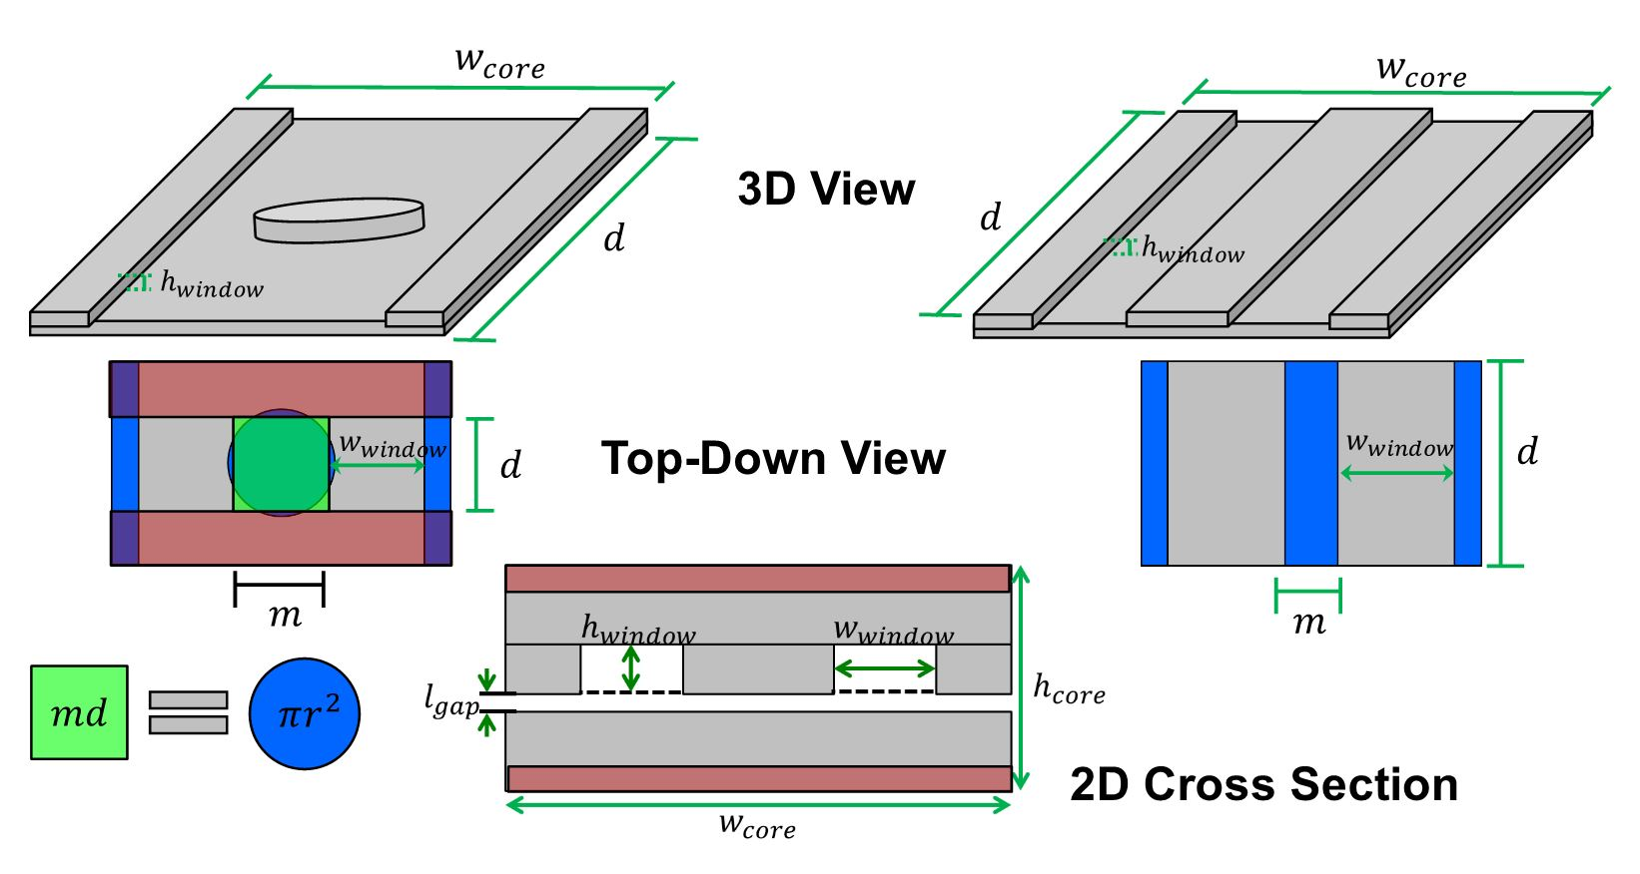
Triangular Current Mode Boost Inductor Optimization using Two-dimensional Finite Element Analysis and the Improved Generalized Steinmetz Equation (IGSE)


Our library includes the Center's technical papers published in conference and journal papers, presentations, recordings, thesis and dissertations produced by graduates, and a research volume series compiled by CPES faculty.
Visit Resources Visit Research
One of the Center's missions is to develop and education program that promotes multi-disciplinary, team-driven, and systems-oriented training to CPES students, as well as provide continuing education opportunities to our industrial partners.
Visit Education
CPES continuously releases news regarding our conferences, faculty, and students. We also provide a list of events for webinars, conferences, and many other facets!
Visit News/EventsCPES is proud to congratulate Tianyu Zhao on the successful defense of h...
The Center for Power Electronics Systems (CPES) is proud to congratulate...
CPES is proud to congratulate Tyler McGrew on the successful completion ...
All engineers from HDI Member companies are invited to the upcoming Revi...
Save the Date!

The CPES Industry Consortium cultivates connectivity among researchers in academia and industry, and creates synergy within the network of industry members. Our industry consortium is the backbone of our strong technology transfer success.
Visit Industry
The Center for Power Electronics Systems (CPES), with annual research expenditures of $6-7 million dollars, is dedicated to improving electrical power processing and distribution that impact systems of all sizes – from battery-operated electronics to vehicles to regional and national electrical distribution systems.
Learn About CPES
The Jobs/Internship Openings page permits anyone from a CPES Member company to post open positions. The person posting can provide supporting information including the position title and description, location, application link, etc. The notices are reviewed and posted where they are accessible to anyone who creates a free account on the CPES website.
Jobs Postings
