LIBRARY
Un-Terminated, Low-Frequency Terminal-Behavioral D-Q Model of Three-Phase Converters

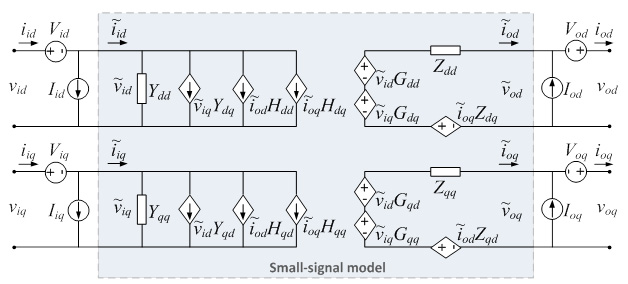
The four-port network can be directly used to build the small-signal linear model of the ac-ac converter around the particular operating point (Fig. 1). The four matrices of transfer functions (2x2 each) can be defined as: Go- audio susceptibility, Zo- output impedance, Yi- input admittance and Hi- back current gain. The terminal-behavioral model consists of four separate sets of measurements on the 3-phase converter working at a desired operating point. Although 16 un-terminated transfer functions describe dynamics of the converter, a total of 24 functions need to be measured to decouple the source and load dynamics from the measured transfer functions.
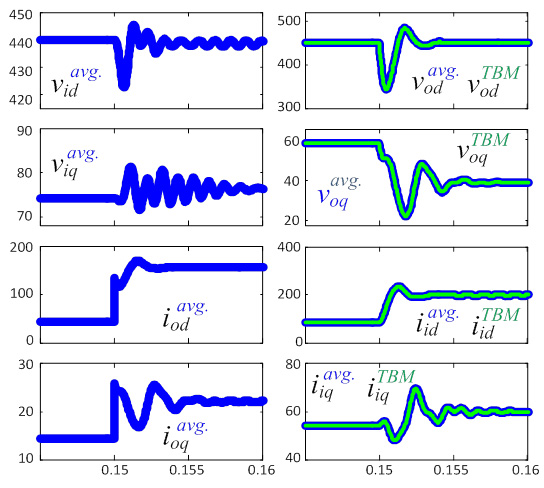
Using two more matrices, transconductance and transresistance, the transfer functions must be decoupled, or "un-terminated," in order to fully characterize the dynamics of a particular converter. Expression (1) presents a generalized linear transformation that derives the un-terminated transfer functions from the measured, terminated functions (denoted with the letter m in the index) for any ac-ac, ac-dc, dc-ac and dc-dc converter. The result of decoupling is shown in Fig. 2.


