


LIBRARY
Trends in SiC MOSFET Threshold Voltage and On-Resistance Measurements from Thermal Cycling and Electrical Switching Stresses
Year: 2018 | Author: Joseph Kozak | Paper: D1.3
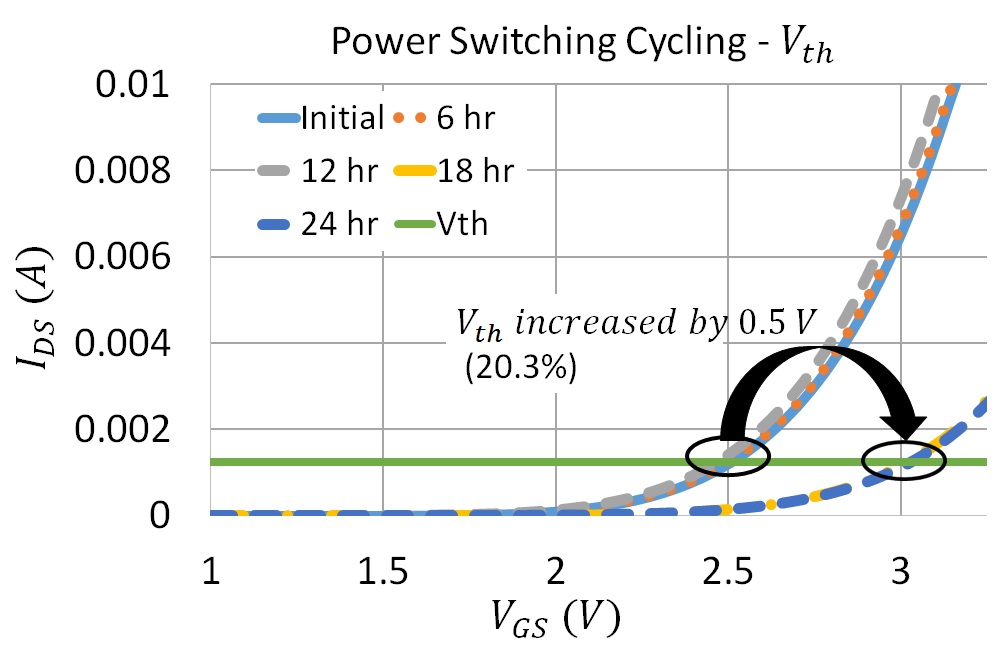
Fig. 1. Changes in threshold voltage from power switching cycling.
This work shows experimental device degradation caused by continuous switching events (power switching cycling) at 90 percent of the devices breakdown voltage. Threshold voltage and on-resistance measurements have been taken every six hours. Changes in the threshold voltage from power switching cycling are shown in Fig. 1. As illustrated, the semiconductor itself is being degraded through the transient electric field generated through continuous switching events.
Thermal cycling experiments have also been conducted between -40° C and 175° C in order to observe degradation in the mechanical packaging of the device. Measurements of threshold voltage and on-resistance were taken every 500 cycles. The normalized changes in ON-resistance are shown in Fig. 2. These changes are caused by the degradation of the interconnections of the package itself, and not the semiconductor. The results from both experiments also illustrate the spectrum between device and package degradation from accelerated test methods.
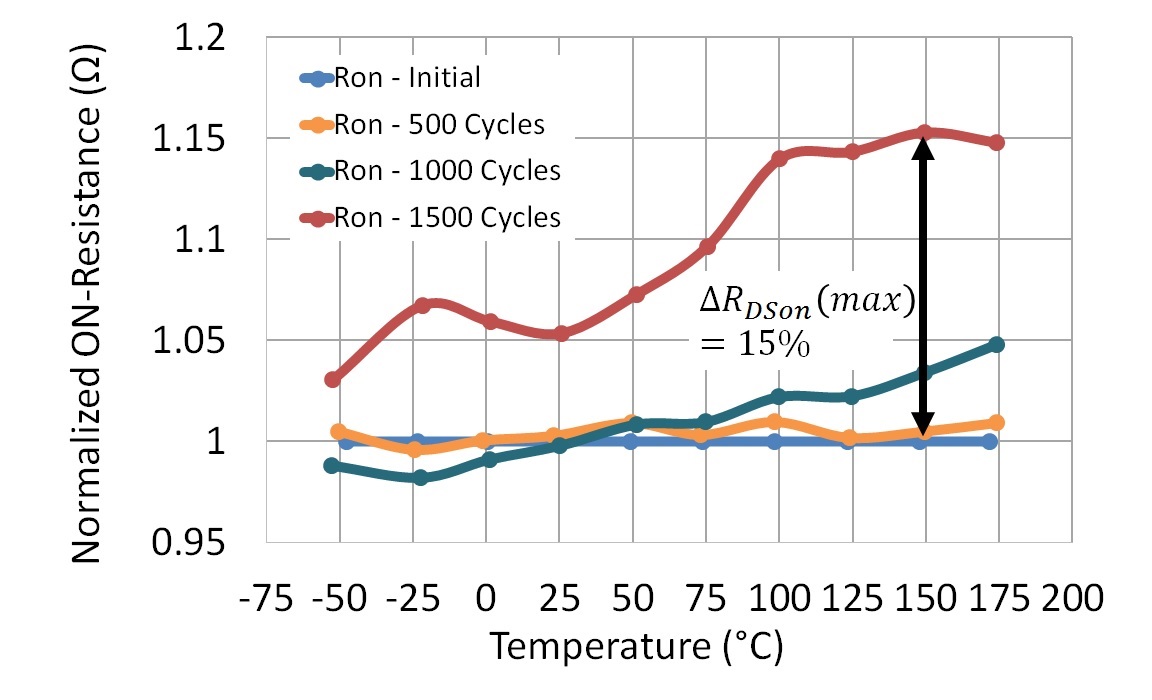
Fig. 2. Normalized changes in on-resistance from thermal cycling.